OceanTrendsTheory
vip
Market Analyst
Futures Trading Strategist
Crypto Market Researcher
8 years of being a sucker, having experienced both bull and bear markets, objective opportunities, valuable insights dissemination.
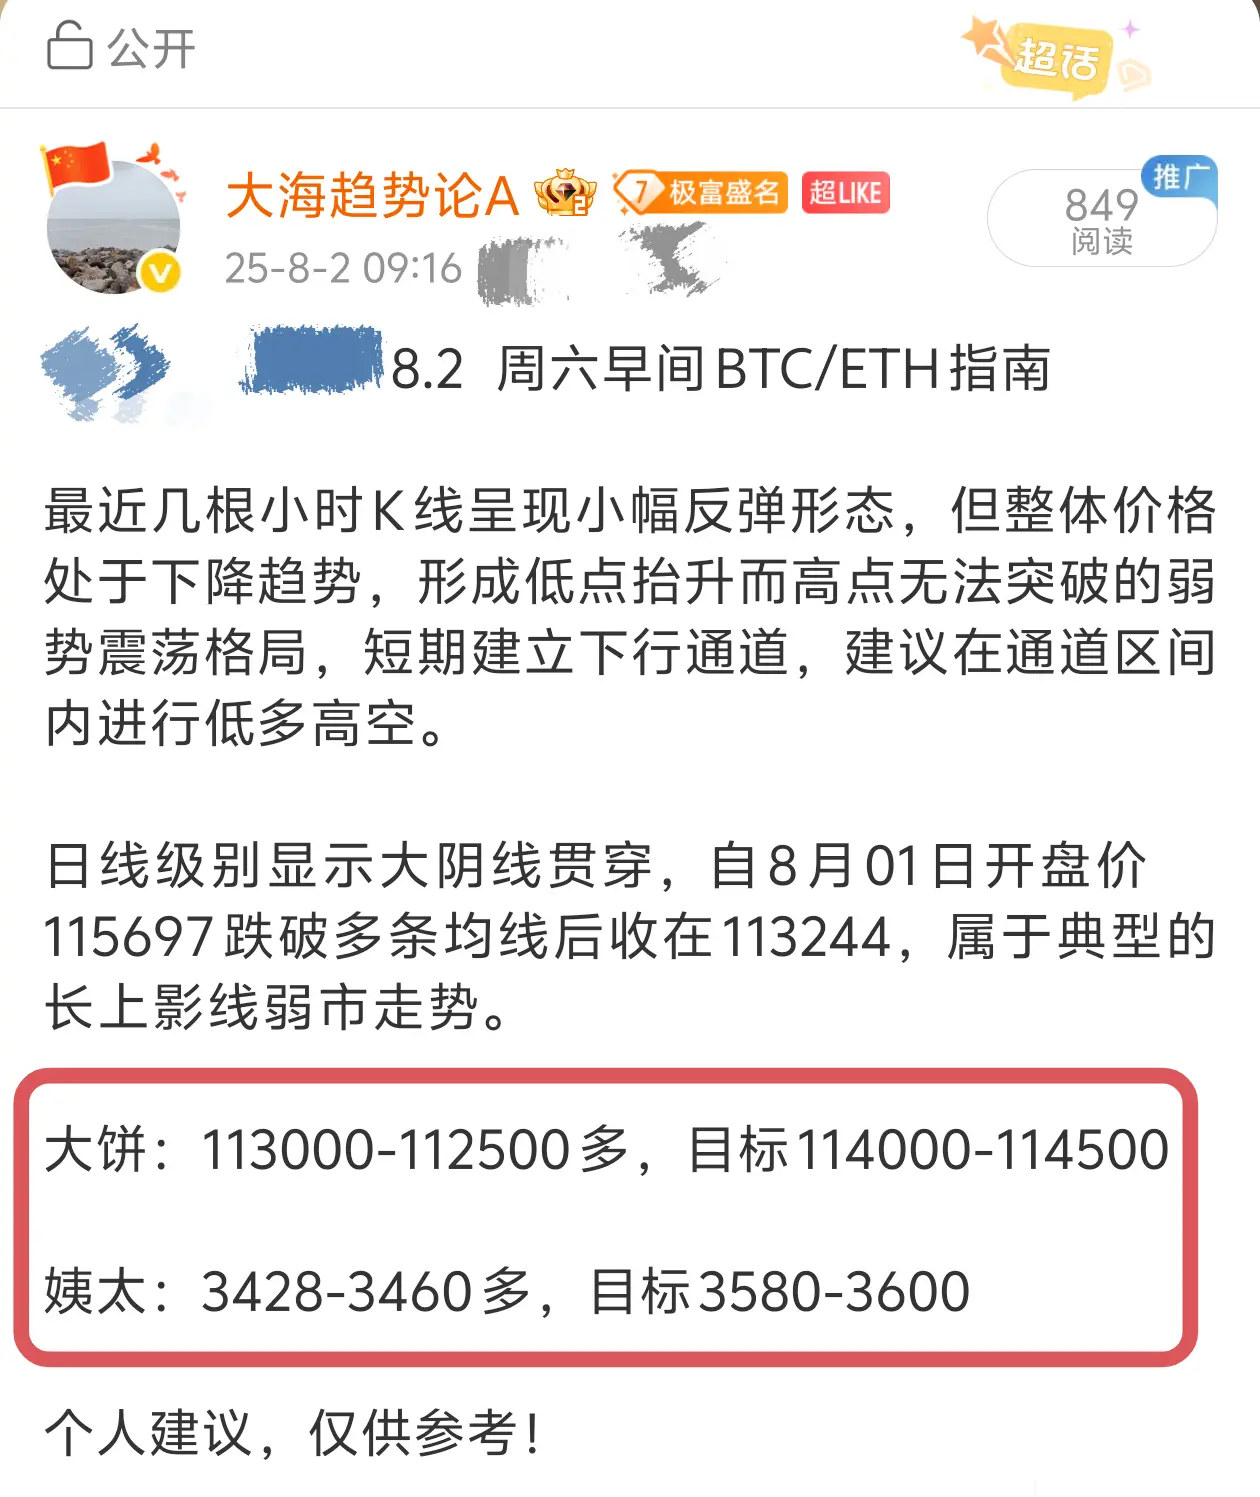
8.2 Saturday Evening BTC/ETH Guide
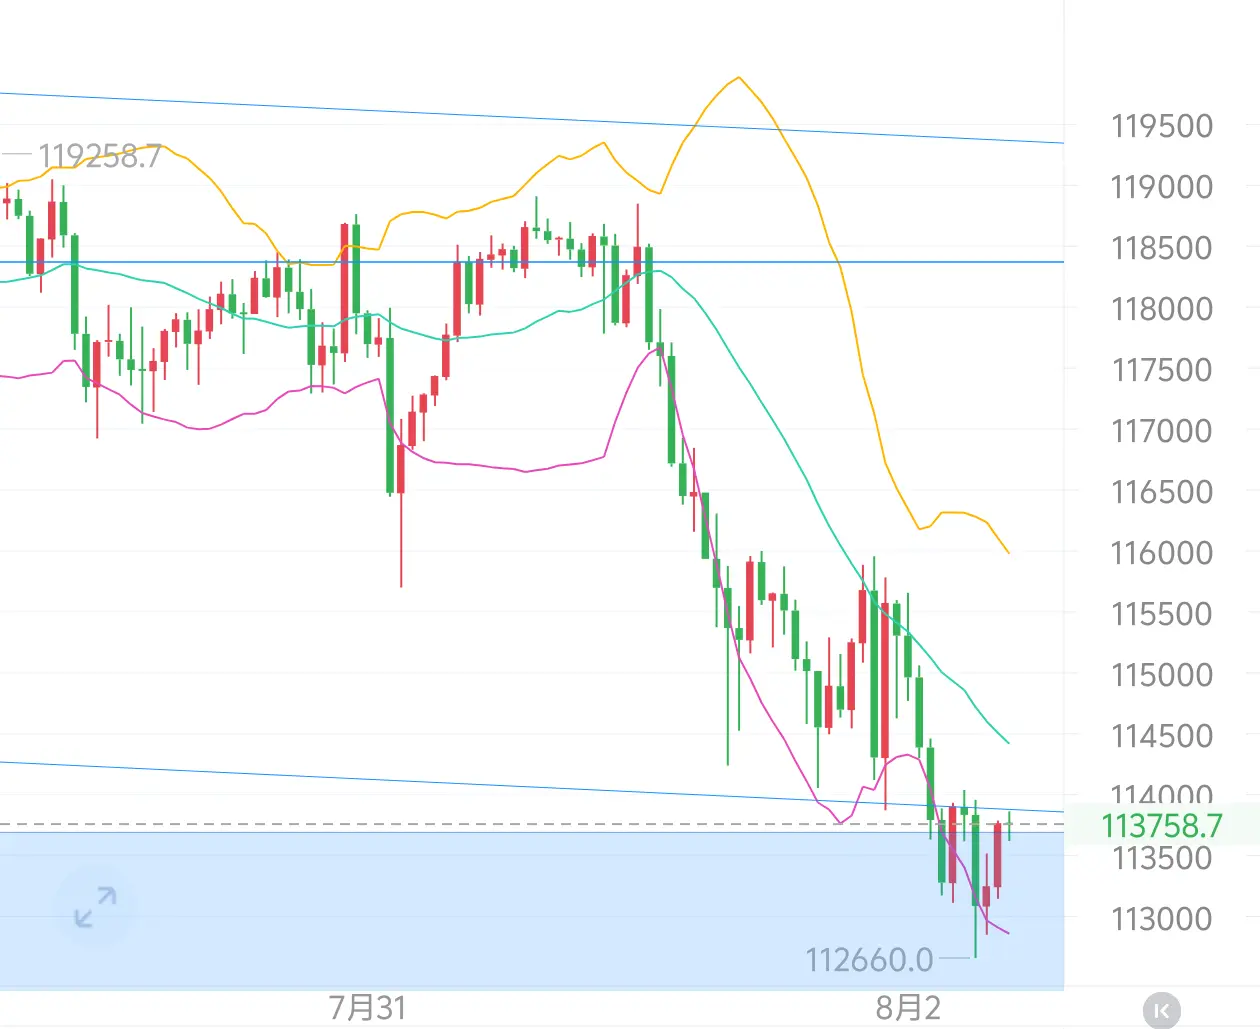
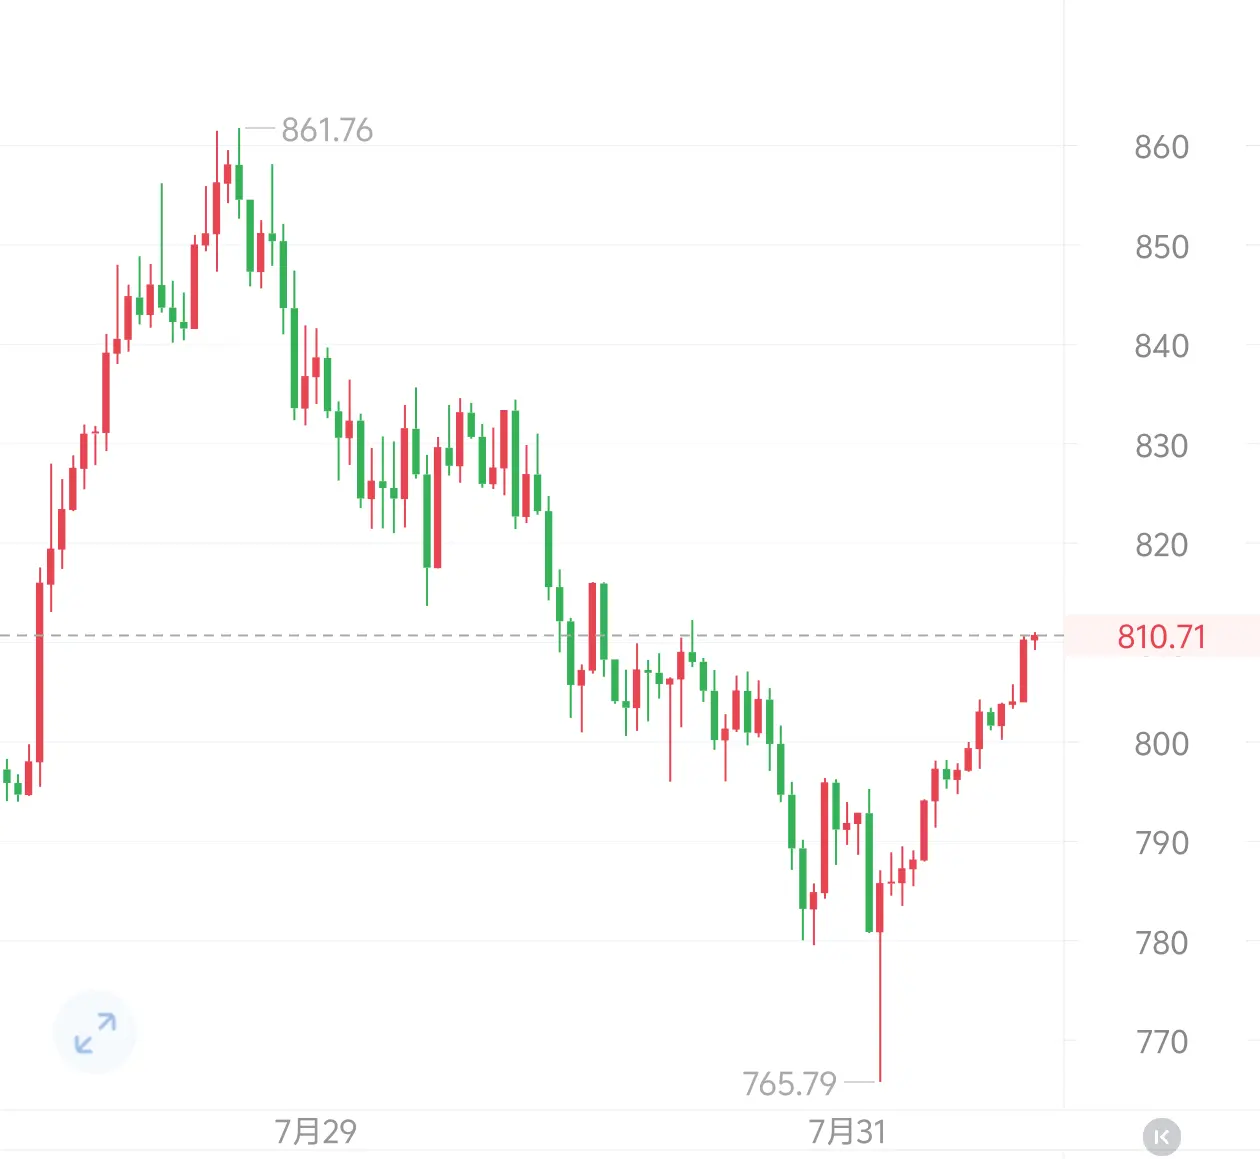
Recently, the K-line of BTC has shown wide fluctuations, oscillating in the range from 115697 to 113682, with the recent closing price lingering continuously around 113600 to 113700.
Yin and yang intertwine, the overall volatility narrows, the bullish counterattack weakens, pay attention to whether the range consolidation breaks.
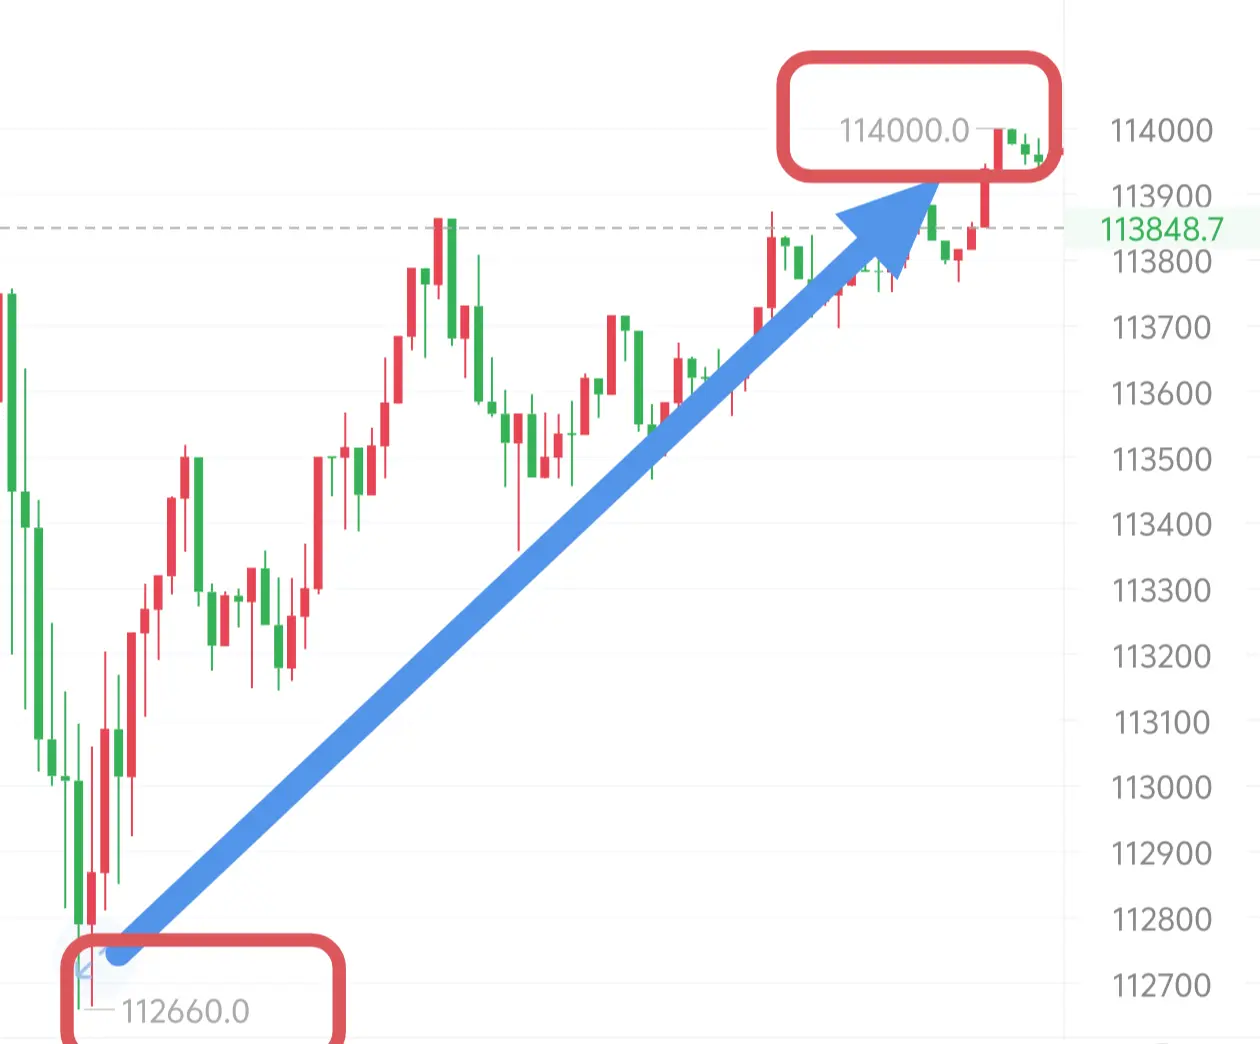
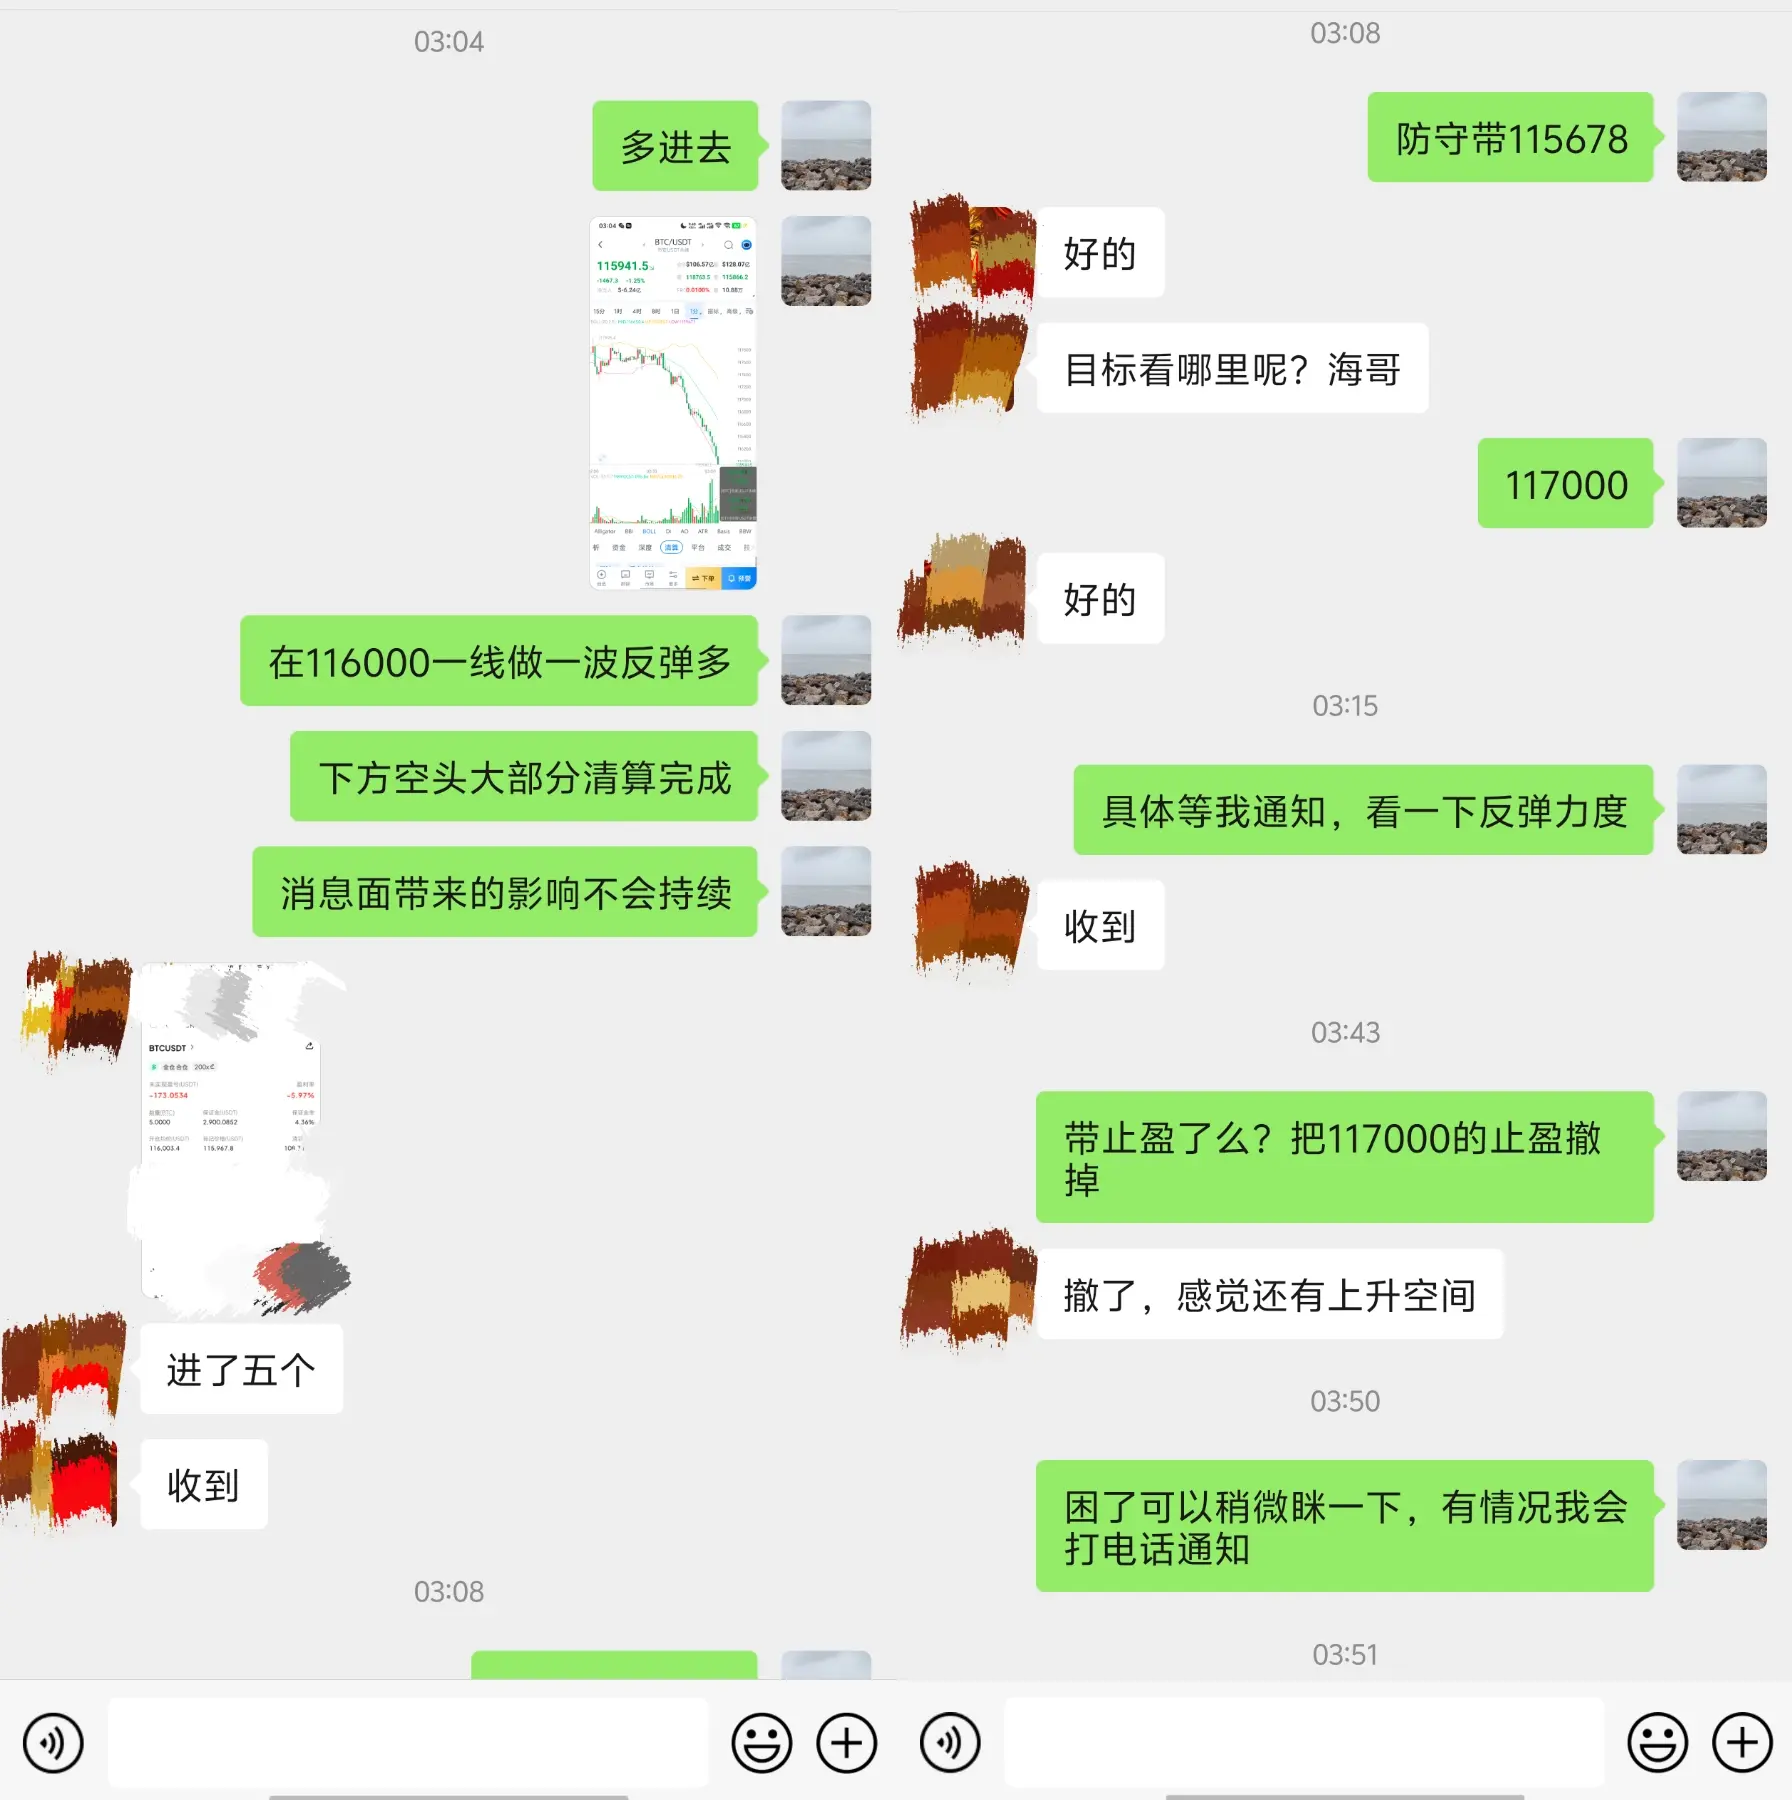
BTC: 112500-113000 long, target 114000-114500
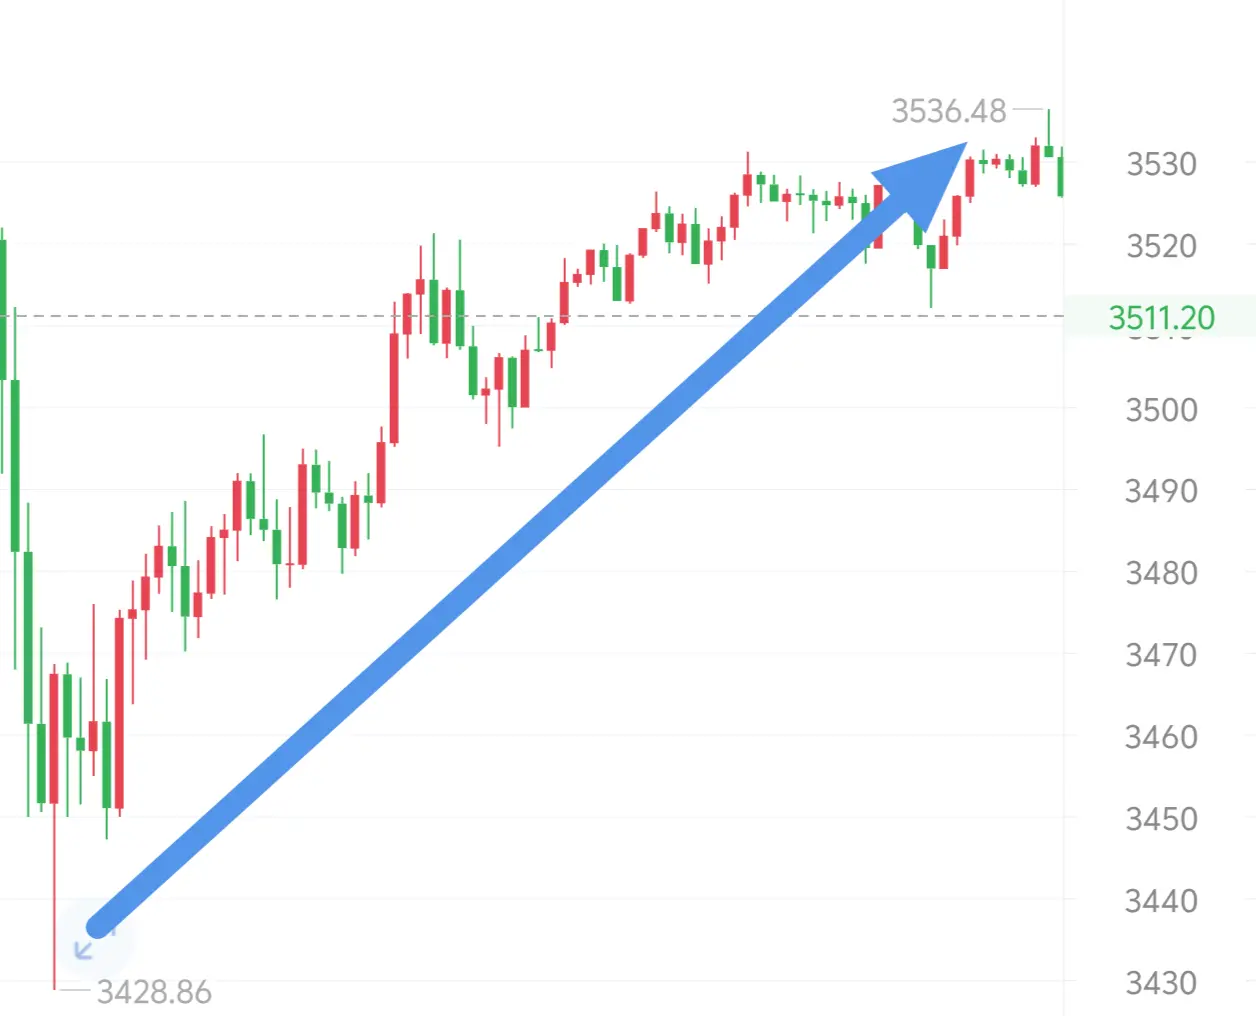
Auntie: 3450-3470 more, target 3550-3570
Personal advice, for reference only!
BTC0.04%
ETH-0.75%
View Original
  • Reward
  • Comment
  • Share
In simple terms, the price of BTC has already fallen below the key support level of 115000, the 200EMA moving average. In the short term, the market has turned bearish. The price is currently hovering around 113000, and if it falls below the support point of 112850, it may drop even faster, heading straight for 110000.

From a technical perspective, the RSI indicator has fallen below 30, indicating that selling may be a bit excessive (oversold), but the green bars in the MACD indicator are still increasing in length, meaning that the strength of the bears has not weakened yet.

In addition,
BTC0.04%
TRUMP0.59%
View Original
  • Reward
  • Comment
  • Share
Yesterday morning, the low long strategy for BTC had over 1k points of space. The target of 114000 was a perfect take profit, and ETH also had a hundred points of space.
BTC0.04%
ETH-0.75%
View Original
post-image
post-image
post-image
  • Reward
  • Comment
  • Share
8.2 Saturday Morning BTC/ETH Guide
Recently, a slight rebound pattern has appeared in the hourly K-lines, but the overall price is in a downtrend, forming a weak oscillation pattern with rising lows but unable to break through the highs. A downward channel is established in the short term, and it is recommended to long at the low end and short at the high end within the channel range.
The daily chart shows a large bearish candlestick piercing through, closing at 113244 after breaking below multiple moving averages from the opening price of 115697 on August 01, which is a typical weak market tr
BTC0.04%
ETH-0.75%
View Original
post-image
  • Reward
  • Comment
  • Share
Today's BTC swing trade perfectly brought in 3,500 points! Profit of 25,000 U!
BTC0.04%
View Original
post-image
post-image
  • Reward
  • Comment
  • Share
BNB's market retraced to the key support level of 765 last night and quickly rebounded. This position is an important support point in BNB's recent fluctuation range, and it is also the confluence zone of the previous rise's Fibonacci retracement level and the MA60 moving average. A retracement that does not break down and is accompanied by reduced volume stabilization indicates that long positions have strong buying pressure in this area, providing technical support for the subsequent rebound.
BNB suggestion: go long around 790-800, with a swing target of 860, and a medium to long-term target
BNB-1.2%
View Original
post-image
  • Reward
  • Comment
  • Share
The market never lacks opportunities, but opportunities will not wait for "complete certainty"—by the time everything is clear, it often has already risen significantly, and getting on board at that point instead becomes catching a falling knife.
View Original
post-image
post-image
post-image
post-image
  • Reward
  • Comment
  • Share
  • Topic
    1/3
  • Pin
Trade Crypto Anywhere Anytime
qrCode
Scan to download Gate app
Community
English
  • 简体中文
  • English
  • Tiếng Việt
  • 繁體中文
  • Español
  • Русский
  • Français (Afrique)
  • Português (Portugal)
  • Bahasa Indonesia
  • 日本語
  • بالعربية
  • Українська
  • Português (Brasil)